Plots a marine spatially-explicit metric on a World map. Basemap layers
(continents, oceans, graticules) come from the Natural Earth website
https://www.naturalearthdata.com/. The map is plotted in the Robinson
projection (EPSG = 54030).
Usage
ggmap_marine(data, metric, title = NULL, palette = viridisLite::turbo(n = 100))Arguments
- data
an
sfobject. The spatial layer (POLYGONS,POINTS, etc.) containing the variablemetricfor which values are to be mapped. For aesthetic purposes, this layer should contain only marine values (terrestrial areas will be masked by the continent layer). Seeggmap_terrestrial()for mapping a freshwater (or terrestrial) layer. This spatial layer must be defined in the WGS84 coordinate system (EPSG=4326).- metric
a
characterof length 1. The column indatafor which values are to be mapped. This variable must be numeric.- title
a
characterof length 1. The title of the map (legend title). Default isNULL(no title).- palette
a
characterof colors used to categorize the values ofmetric. Default isviridisLite::turbo()with 100 colors.
Examples
## Attach packages ----
library("rphenofish")
library("ggplot2")
## Path to example marine layer ----
file_name <- system.file(file.path("extdata", "marine_fish_richness.gpkg"),
package = "rphenofish")
## Import example marine layer ----
marine_fish_richness <- sf::st_read(file_name, quiet = TRUE)
marine_fish_richness
#> Simple feature collection with 232 features and 3 fields
#> Geometry type: MULTIPOLYGON
#> Dimension: XY
#> Bounding box: xmin: -180 ymin: -89.9 xmax: 180 ymax: 86.9194
#> Geodetic CRS: WGS 84
#> First 10 features:
#> ECO_CODE ECOREGION richness
#> 1 20001 North Greenland 8
#> 2 20002 North and East Iceland 12
#> 3 20003 East Greenland Shelf 12
#> 4 20004 West Greenland Shelf 53
#> 5 20005 Northern Grand Banks - Southern Labrador 118
#> 6 20006 Northern Labrador 153
#> 7 20008 Hudson Complex 150
#> 8 20011 Beaufort-Amundsen-Viscount Melville-Queen Maud 70
#> 9 20012 Beaufort Sea - continental coast and shelf 91
#> 10 20013 Chukchi Sea 96
#> geom
#> 1 MULTIPOLYGON (((-32.6413 86...
#> 2 MULTIPOLYGON (((-8.65768 67...
#> 3 MULTIPOLYGON (((-12.04675 7...
#> 4 MULTIPOLYGON (((-48.27762 7...
#> 5 MULTIPOLYGON (((-52.19067 5...
#> 6 MULTIPOLYGON (((-68.0207 67...
#> 7 MULTIPOLYGON (((-69.57845 6...
#> 8 MULTIPOLYGON (((-124.2147 7...
#> 9 MULTIPOLYGON (((-153.7874 7...
#> 10 MULTIPOLYGON (((178.316 67....
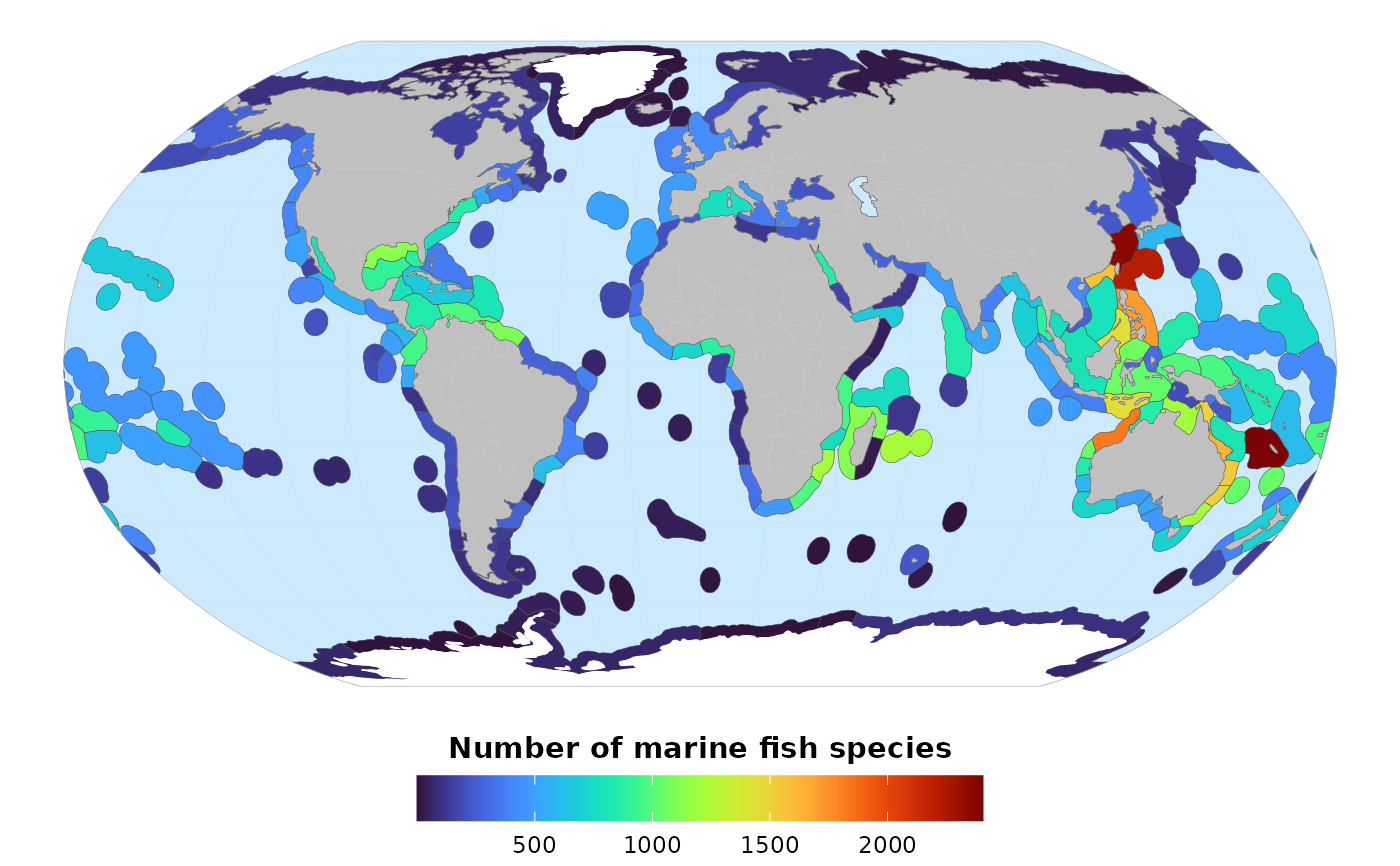
## Map marine fish richness ----
marine_map <- ggmap_marine(data = marine_fish_richness,
metric = "richness",
title = "Number of marine fish species")
marine_map
 if (FALSE) {
## Save map in PNG ----
ggsave(plot = marine_map,
filename = "marine_fish_richness.png",
width = 20,
height = 13,
units = "cm",
dpi = 300,
bg = "white")
}
if (FALSE) {
## Save map in PNG ----
ggsave(plot = marine_map,
filename = "marine_fish_richness.png",
width = 20,
height = 13,
units = "cm",
dpi = 300,
bg = "white")
}